DL850E /DL850EV SCOPE CORDER
Introducing Our Ultra-Fast Memory Recorder
- High-speed (up to 100 MS/s), High Resolution (up to 16-bit), Isolated (up to 1kV*1)
- Multi-channel, up to 128 voltage or 128 logic bits
- Continuous hard disk recording at 100 kS/s simultaneously on 16 channels*2
- CAN bus monitoring and trend waveform display (DL850V only)
- 15 plug-in modules
*1. With the isolated probe (700929 or 701947)
*2. With the /HD0 or /HD1 option
The DL850 ScopeCorder Series are modular, waveform recording instruments that can measure voltage, current, strain, acceleration, and other phenomena-- simultaneously. With high speed sampling, high isolation withstand voltage, and multichannel measurements, the DL850 Series offers powerful support in the development, evaluation, and quality control of energy efficient devices.
For increasingly fast inverter signals
High speed (100 MS/s), High resolution (12-bit), 1kV isolated measurements.*
Yokogawa's isoPRO technology offers industry-leading isolation performance at the highest speeds. The isoPRO core technology is designed with energy savings applications in mind. It gives you the performance needed to develop high efficiency inverters, which employ high voltages, large currents, and high operating speeds.
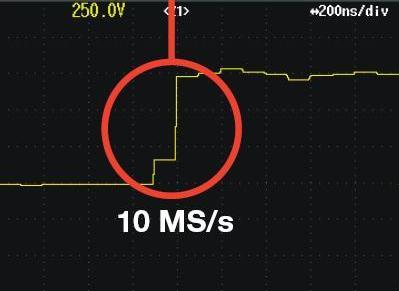
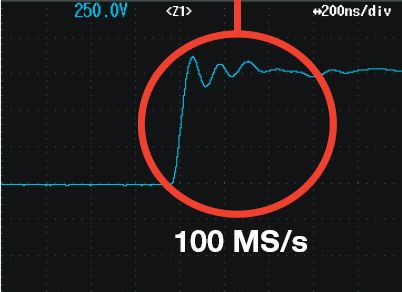
Example - Measuring Inverter Output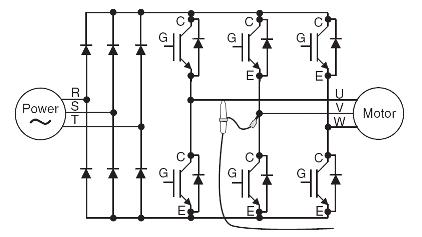 Accurately observe inverter startup waveforms with sufficient time resolution. You can confirm that no excessive overshoots occured.
| High Speed & High Withstand Voltage Isolation Technology | ||
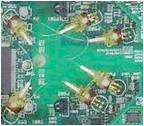 |
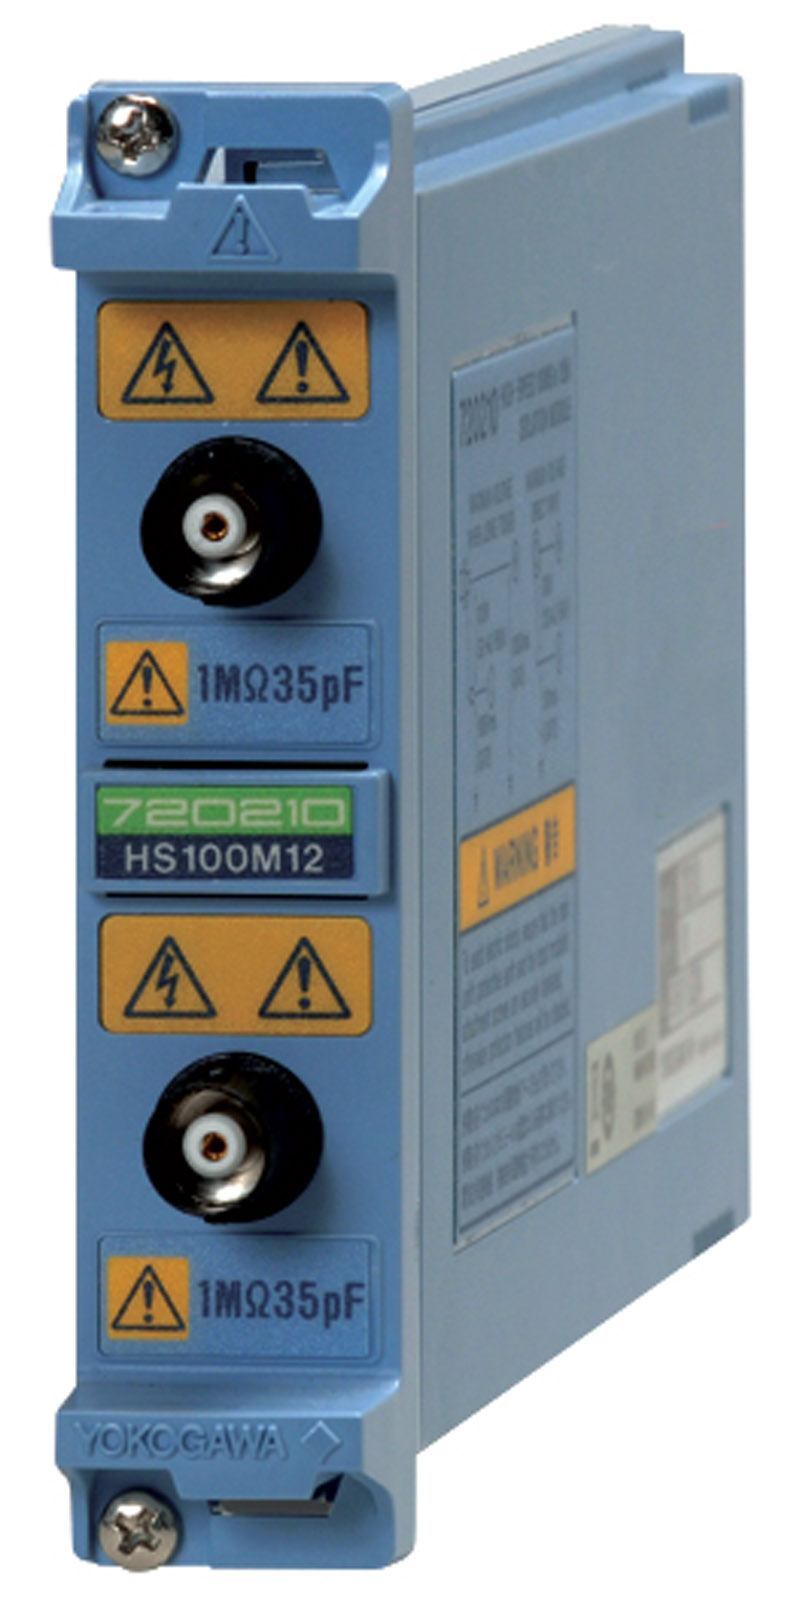
Using high speed optical fiber-based transmissions, the module achieves high speed ADC clock and data isolation. 720210 High-speed 100 MS/s 12-Bit Isolation Module |
 |
|
Rising waveform not completely captured
|
Rising waveform accurately captured
|
With 15 unique plug-in module types, the DL850 can handle nearly any measurement task.
The DL850 is backwards-compatible with all modules of its predecessor, the DL750. In addition, four new modules have been added to the lineup. Combine modules at will to measure anything from minute voltages to high-speed, high withstand voltages.
|
|
Advanced - Even More Measurement Points - Up to 128 CH of voltage input and 128 bits of logic input
The 16-CH Voltage Input Module (scanner type*) can measure at 10 kS/s sample rate even when using all 16 channels. With this module populating all 8 input module slots, the DL850 performs 128-CH voltage measurements.
The Logic Input Module supports everything from TTL levels, to high voltage contact closures at up to 10 MS/s*. With eight logic modules, the DL850 can monitor and capture 128 bits of logic.
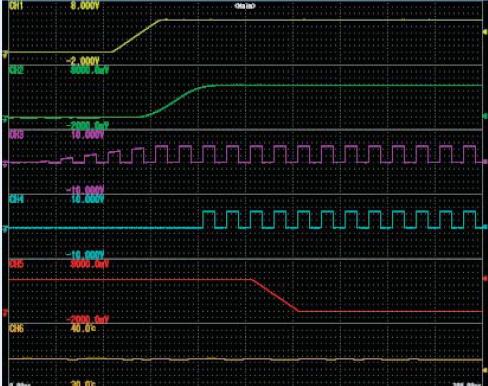
Example: Measuring the startup sequence of a multi-output power source
Power supplies used in home computing electronics have many outputs, and it is necessary to control the sequences from output to output. With a multichannel module, you are not limited to voltage measurements; a single unit can also measure everything from PC control signals to AC fan operation, individual component temperatures, and slow to high-speed signals.
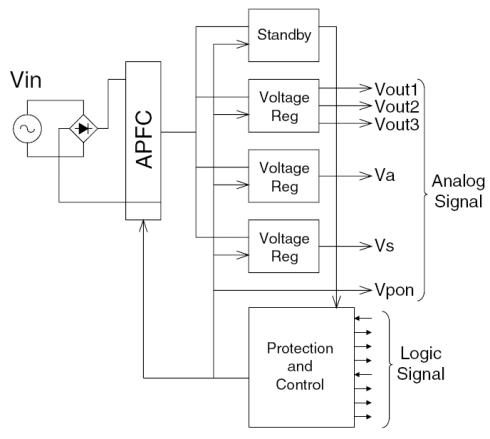 |
Ch 1: AC Input Voltage Ch 6: Supply Voltage Ch 2: Reference Voltage Ch 3: Reset Signal Ch 1: Fan Rotation 16-bit logic: Control Signals 4-bit logic: Serial Communication |
 |
Catch transients in durability with high-speed sampling - Dual Capture
To visualize long term trends in durability testing and other situations, data is typically acquired at low-speed sample rates. on the other hand, suddenly-occurring transitional phenomena should be captured at high-speed sample rates.
The "Dual Capture" feature resolves these conflicting requirements by recording at two different sampling rates.
-
Zoom Waveform - You can record up to 5,000 phenomena of high speed trigger measurements (up to 100 MS/s) at a record length of 5-500 kPoints while taking trend measurements at up to 100 kS/s.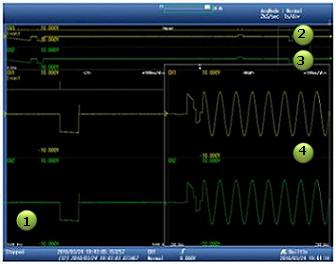
- Event Waveform -Displays the timing at which high speed "sub" waveforms are acquired
- Low Speed Main Waveform - Max: 100 kS/s Trend waveform displayed in a low-speed Roll mode
- Capture Waveform - Max 100 MS/s Capture transients with high speed trigger measurement
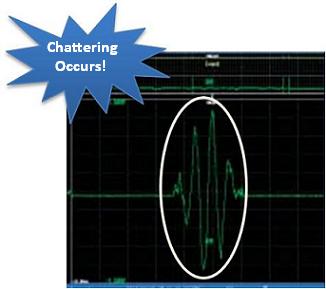
Example: Parts Durability Testing
Parts used in automobiles and other transportation vehicles must be highly reliable. The "Dual Capture" function is very effective when performing vibration testing of connectors under varying temperatures.
- Chattering is accurately caputured at high-speed sampling
- Check the frequency of occurence at low-speed sampling
Recall Past Waveforms - History Function
When you spot an abnormal phenomenon during repetitive high speed measurements, often the anomaly has disappeared from the screen by the time you press Stop.
Always active, the "History" function automatically divides the long memory into up to 5,000 "history waveforms" that can be redisplayed at any time.
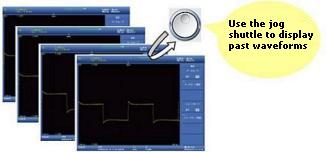 To extract abnormal waveforms |
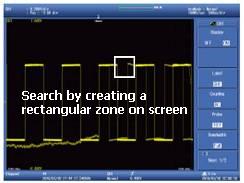 |
Searching history waveforms
When you want to extract abnormal phenomena exclusively, you can perform condition-based searches of the history waveforms. You can create a rectangular zone on screen and extract only waveforms that pass through or do not pass through the zone. You can also extract data based on amplitude and other parameters.
To check the history...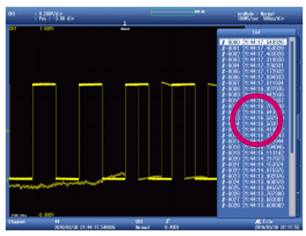 |
You can display all past waveforms, and view a list of acquisition times at min 1µs resolution |
| Key Point The History function requires no action during measurement. You can recall data at any time after measurement has been completed. once waveforms have been recalled, you can zoom locations of interest or perform parameter measurements. |
Armed with an array of trigger functions
Simple & Enhanced Triggers
The DL offers easy-to-use "Simple" triggers, or lets you combine various "Enhanced" triggers for even more advanced capturing.
Enhanced trigger conditions are set up intuitively in advanced, easy-to-understand graphical user interface

Simple
- Edge: Trigger on a single trigger source condition (rising, falling, rising/falling)
- Time: Trigger at a specified time or fixed interval
Enchanced
- A -> B(N): Trigger when condition B is true N times after condition A becomes true
- A Delay B: After condition A becomes true, trigger the first time condition B becomes true after a set time has passed
- Edge on A: Trigger on an OR condition of an edge trigger while the A trigger is true.
- OR: Trigger if at least one trigger condition of multiple trigger sources is true
- AND: Trigger if all trigger conditions of multiple trigger sources are true
- Period: Trigger when a condition regarding the waveform period becomes true
- Pulse Width: Trigger on a condition relating a pulse width condition being true with a specified time width condition.
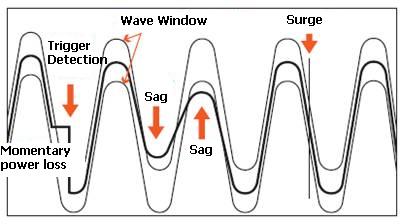
- Wave Window: Trigger when the signal passes outside of an real time template "Wave Window"
Example: "A Delay B" trigger setup screen (GUI)
Wave Window Trigger
The Wave Window trigger is useful for diagnosing typical power supply troubles such as momentary loss, sags, and surges. It can also detect frequency changes, voltage drops, and other phenomena, with support for AC waveforms of 40 to 1,000 Hz. A reference waveform (Real time template) is compared with the current waveform, and a trigger activates if the current waveform falls outside of the allowable range. The reference waveform is generated automatically from the previous waveform in real time.
|
*The Wave Window is not displayed on the display. |
Action on Trigger
To capture infrequently occurring phenomena, you can use an "Action on Trigger" to perform multiple actions that are specified in advance when a trigger occurs.
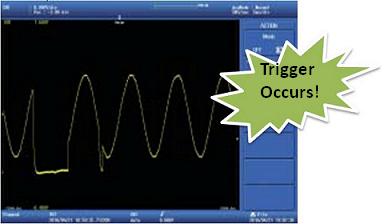 |
You can specify "e-mail transmission" for immediate notification in a remote location when a phenomenon occurs. |
| |
Superior Noise Rejection
 Excellent noise rejection performance is achieved through meticulous low-noise design. Floating voltage switching waveforms in inverter circuits can also be captured with precision.
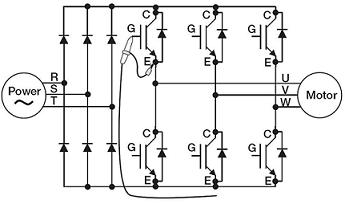 |
Example: Measuring inverter gate signals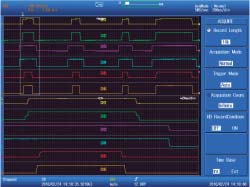 |
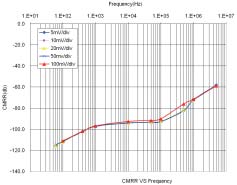 Model 701250 Voltage Input Module |
Processes Noise Rejection and Executes Power Computations in Real Time - Realtime Math (coming soon)
The DL850 is armed with a dedicated DSP (digital signal processor) for computations that enables between-channel math during waveform capture. These between-channel computations are powerful because they can be set up separately from filter computations. In addition to FIR, IIR, Gauss, and moving average filters, you can use arithmetic with coefficients, integrals and differentials, and higher-order equations.
- Display any combination of measured and math waveforms (up to 16 total).
- You can assign channels without modules.
| Example: 3-Phase Power Computation | |
| Power is calculated as the integral of the product of voltage and current over time (an average based on the period). Using the Realtime Math function, you can display 3-phase 3-wire power waveforms in real time. |  |

| Key Point Computations occur in real time even when in Roll mode. Computed waveforms can also be used to activate triggers. |
A wealth of functions gets you right to the waveform you want - User Defined Computation (/G2 option)
The DL comes standard with arithmetic, time shift, FFT, and other computations that enable you to display waveforms with offsets and skew corrections. And with user defi ned computations (/G2 option), you can create equations using a combination of differentials and integrals, digital fi lters, and a wealth of other functions.
User Defined Computation Setup Screen

| Example: Amplitude Analysis Using FFT | |
| With the User Defi ned Computation function(option) included, you can perform various-types of FFT analysis using two FFT windows. In applications such as vibration and shock tests, you can easily evaluate abnormal vibrations while simultaneously measuring other signals. |  |
| Key Point You can assign a log scale to the frequency axis. |
Automatically extract waveform amplitude, frequency, and other parameters - Waveform parameter and statistical computation
Extract and display up to 24 of the 26 available waveform parameters (amplitude, frequency, etc.) simultaneously. Menus can be shown as lists of easy-to-read icons.
| Statistical Computation | |
| The DL can automatically extract cycle waveforms and find the standard deviation and other statistics. Computations can be performed on history waveforms as well. |  |
Detect Abnormal Waveforms, Notify Users, and Determine Pass/Fail - Go/NO-GO Determination
The DL can determine whether waveforms or computed values of waveform parameters meet (GO) or do not meet (NO-GO) conditions that are specifi ed in advance. Upon judgment of the measured results, a pre-set action is performed and users are notified that an abnormal waveform was observed, along with the pass/fail
determination. This is a very useful function for such things as studying signals from manufacturing lines of electronic devices and tracing abnormal phenomena.
| Example: Evaluating Motor Startup Characteristics | |
 |
Parameter measurement is taken of the time until reaching a reference RPM after motor start, and the subsequent GO/NO-GO (pass/fail) determination is made. |
Synchronize Multiple Units Performing Simultaneous Measurements - IRIG input (/C20 option)
 |
Synchronized measurement across multiple DL850 units is made possible by inputting an IRIG time code signal.* The DL850/ DL850V's internal clock is also synchronized (locked) to the IRIG signal. Therefore, timing comparisons are highly precise even when continuously recording over long periods of time. |
| Key Point You can make periodic observations remotely by connecting commercially available GPS receivers that have IRIG output and using the Time Trigger function. |
Example: Synchronous measurements for large transport vehicles Simultaneously measuring both tips of airplane wings, or between railroad cars requires synchronizing multiple measuring instruments in time. With a single IRIG cable, the acquisition time of all data is made the same.

*IRIG (Inter-Range Instrumentation Group) started as an American military standard, and is now used in data recorders in the aerospace industry. The carrier frequency is a 1 kHz/10 kHz ASK (amplitude shift keying) modulating signal with a synchronizing precision of as high as 1 µs. DL850 support formats: A002, B002, A132, B122
The Flexibility of an External Hard Drive - External Hard Drive Interface (/HD0 option
| With an external hard drive interface, you can connect a commercially available eSATA standard hard drive. The DL can record to an external drive in real time just like it can with the built-in hard drive. After saving waveforms, you can switch the DL850/DL850V from the PC to the external drive and use the waveform data immediately. |  |
Key Point
* The speed of realtime hard drive saving depends on the performance of the hard drive. |
Check the Relationship between Hysteresis and Phase - XY Display Function
You can confirm the relationship between two signals using the X-Y display. This can be applied to measurements such as the phase angle of two sine waves.
You can select four combinations on the X and Y axes, and therefore display multiple X-Y waveforms simultaneously and find relationships between them.
Simultaneous observation of X-Y waveforms and normal T-Y waveforms (waveform display using voltage and time axes) is also possible.
Example: Computing dynamic BH characteristics of a magnetic substance on the DL850 you can measure voltage and current, then analyze hysteresis of magnetic flux density B and magnetic fi eld strength H. Energy loss generated by magnetostriction can be evaluated by measuring dynamic BH characteristics.

Magnetic fl ux density: B = Integ (C1) / (K1*K2)
Magnetic fi eld strength: H = C2*K1 / K3
C1: voltage, C2: current
K1: number of turns, K2: cross sectional area
K3: magnetic circuit length
Newly Developed CAN Bus Monitor Module Now Available

CAN bus is a standard in-vehicle serial bus used for control networks. The DL850V ScopeCorder Vehicle Edition can include a CAN Monitor Module (model 720240) that enables monitoring of CAN protocol communication data as analog values, from which triggers can be activated. Correlations can be identified between communication data on the CAN bus; voltage, temperature, sensor signals, and other analog data; and ECU control logic signals-this lets you evaluate
the overall CAN system.
CAN data acquisition and trend display - CAN Bus Monitor Module

You can also use DBC database files (.dbc) to specify the data to be monitored. Database (definition) files can be loaded and edited by our free Symbol Editor program for conversion to an .sbl file that can be read by the DL850V. Instead of digital code (hex or numeric), you can monitor CAN signals using Messages, Signal names, and physical units.
 |
Example: Comparison and verification of actually measured signals and CAN bus siganals You can check physical value trends of CAN bus data and the corresponding actually measured waveforms on the same screen at once. For example, ignition switch on/OFF signal and the ignition command's corresponding CAN signal can be displayed together with the actually-measured signal from the related voltage sensor or other devices in order to verify any correlation between these signals. |
'오실로스코프' 카테고리의 다른 글
| YOKOGAWA DL9000 vs. Tektronix 4000 video (0) | 2010.08.31 |
|---|---|
| YOKOGAWA DL9000 vs. Agilent 6000 (0) | 2010.08.31 |
| DLM6000 MSO & DSO Series (단종, 대체모델 DLM3000) (0) | 2010.06.03 |
| DLM2000 MSO Series (0) | 2009.11.20 |
| DL9000 MSO Series (단종, 대체모델 DLM2000) (0) | 2009.11.20 |

